This week volatility finally returned to the Cable. And our strategy started faring so much better than during the previous week. Overall, we won the pips amount roughly equal to volatility.
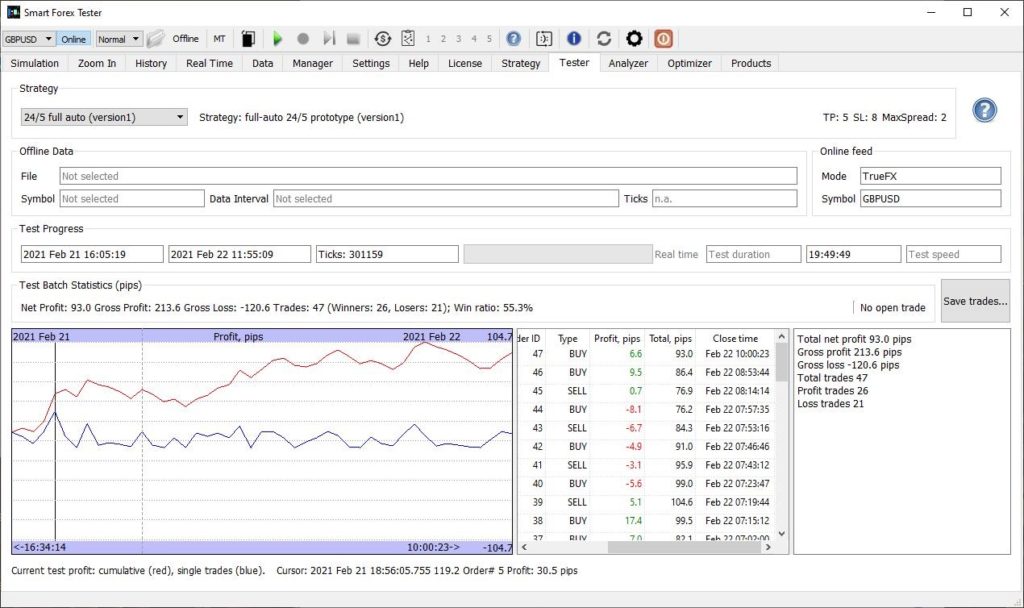
Even for the relatively slow Sunday-Monday trading with only 106 pips volatility, the win ratio exceeded 55%!

The win ratio this high is a comfort zone for our strategy. As a result, it easily gained 93 pips in about 20 hours – with a smooth equity curve.
If you want details, here is the full trade log.
We restarted the test for a 20 minute technical break. Then the test was running non-stop until the end of the trading on Friday, 26.
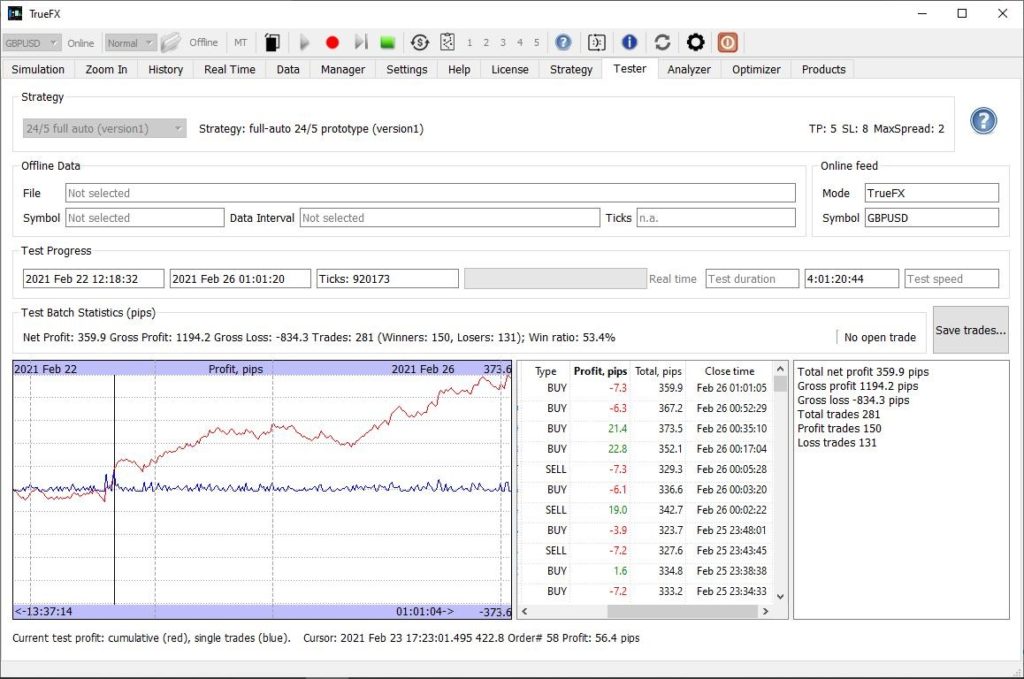
During the rest of the test the win ratio dropped a bit to 53%. However, this is a very comfortable value as well. Combined with high 358 pips volatility, the total result was guaranteed.

The strategy won 360 pips in 4 days – an excellent result. Especially if you consider smooth equity curve with little drawdown. Here is the full trade log.
On the last trading day, we had a software problem. As you may notice, the automated trader stopped functioning in the middle of London trading session (last trade’s time stamp is 01:01:05 – which is ~9am GMT).
The reason for the failure was a lengthy network outage – and the Trader couldn’t fully recover from that.
However, the rest of the software was not impacted by the outage and continued receiving the ticks and recording them when the network connection recovered.
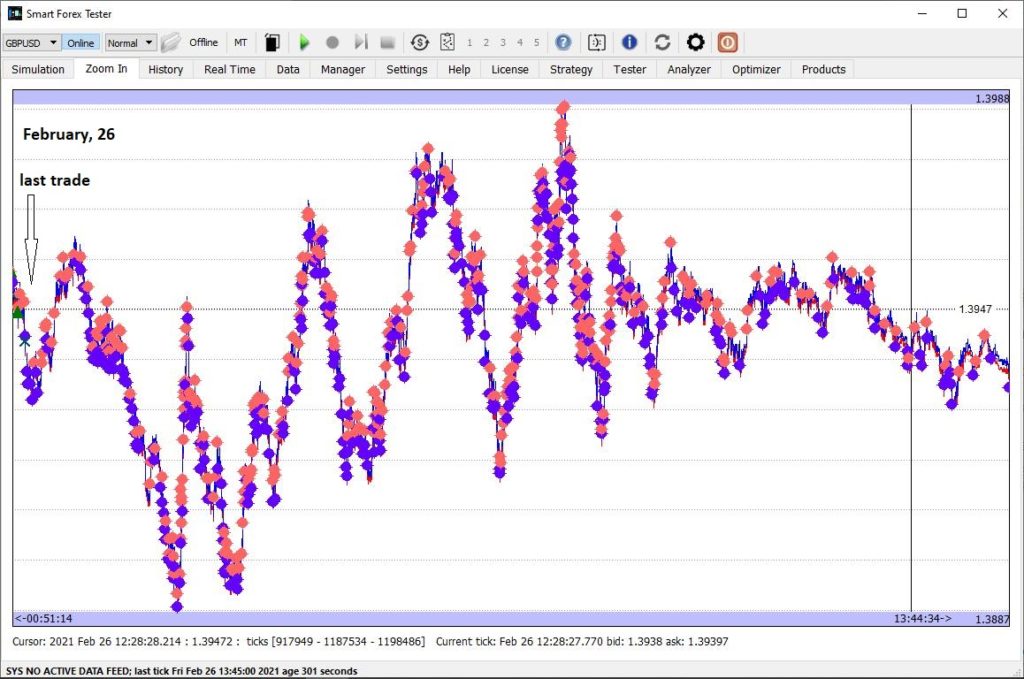
Let’s review the price action during the last hours of Friday trading.

For about 8 hours after the last trade, we observe several “clean” and decent sized up/down moves. These are the best setups for our current strategy to gain.
On the flip side, there are multiple periods of see-sawing, especially closer to the end of the NY trading, where we can also see notably lower volatility. This choppy and overlapping price action price action usually results in losses.
So, we can assume that if the Trader continued to work properly after the network outage, the total profit would probably have not grown very much. But it shouldn’t have decreased much, either.
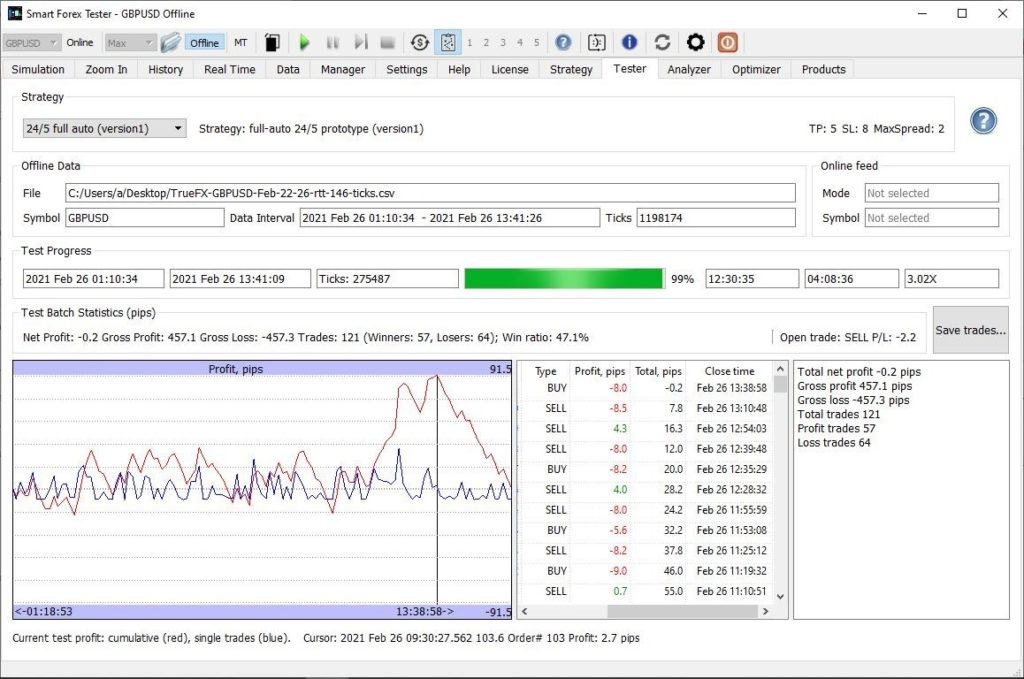
Fortunately, we don’t have to guess. Since we have all the ticks recorded, we can simply run run the same test in our Offline Simulator, which provides 100% market modelling accuracy.
The below screenshot confirms the result was predictable.

In the beginning, the strategy nicely used the big moves and was up almost the same as volatility (106 pips for this period). Only to give away all gains in the last ~4 hours of the NY trading session, when the market started treading water.