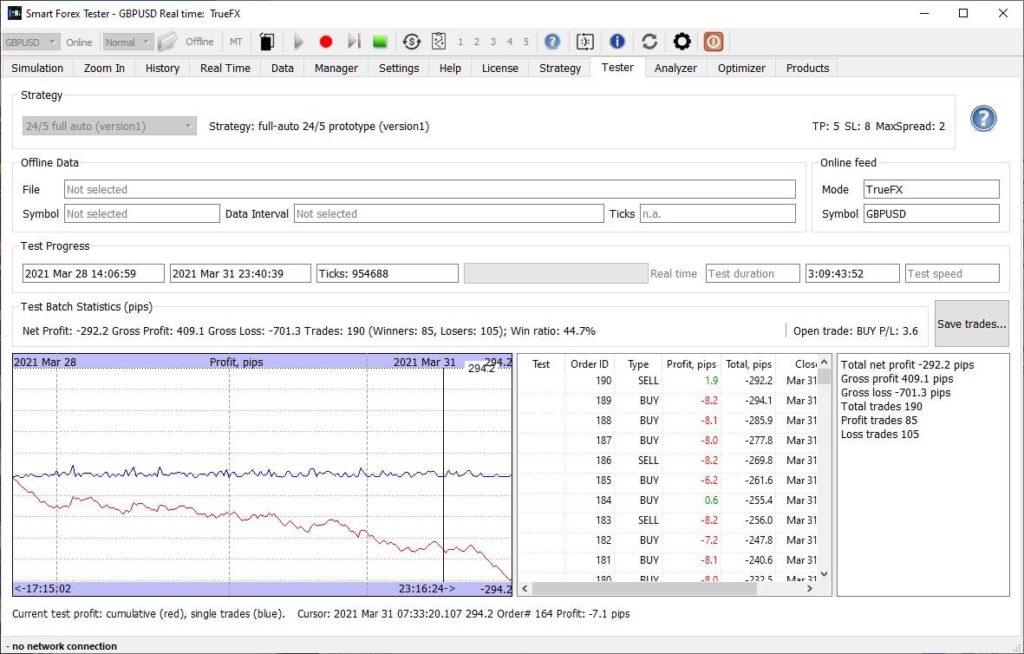
[We combined the report for 3 weeks into one, since they are pretty similar]
Bottom line: the strategy under test had no chances of turning profit in choppy price action with low volatility. This is known. However, half of the time the win ratio was around 50%. It used to be enough to score hundreds of pips of profit in more volatile markets. But not now – even combined with the highest on record potential win ratio. This stresses once again the need of profit taking algorithm improvement. Which could save the outcome even without switching between the current and the mean reversion strategy that we are developing.
That said, despite whopping 1,675.4 pips losses, this is not the end of the world.
Losses are a part of the game: you can’t always win in the market. And overall, we are still over 3,000 pips up since last October.
In addition, one advantage of our strategies is that they don’t try to bet on a small number of huge wins but are gaining from multiple frequent trades. So, in a real trading, it would be easy to stop and cut losses short.
But since we are sticking to our plan, we keep the test running 24/5 with all the setup unchanged. Later on, we will use the recorded ticks to test all the strategy improvements we are currently working on.
If you want to test yourself, here is the collected tick data for March 2021.
The week March 7-12
The second trading week of March was the worst in the entire 5.5 month long test. In total, our automated trader lost 447 pips.
There were only 3 losing weeks before that – and all had some holidays. This week didn’t present any such excuses. It was clearly visible that the overlapping price action with low volatility was a killer.
First 2 days – volatility 129 pips. Not much chance for the version1 strategy.
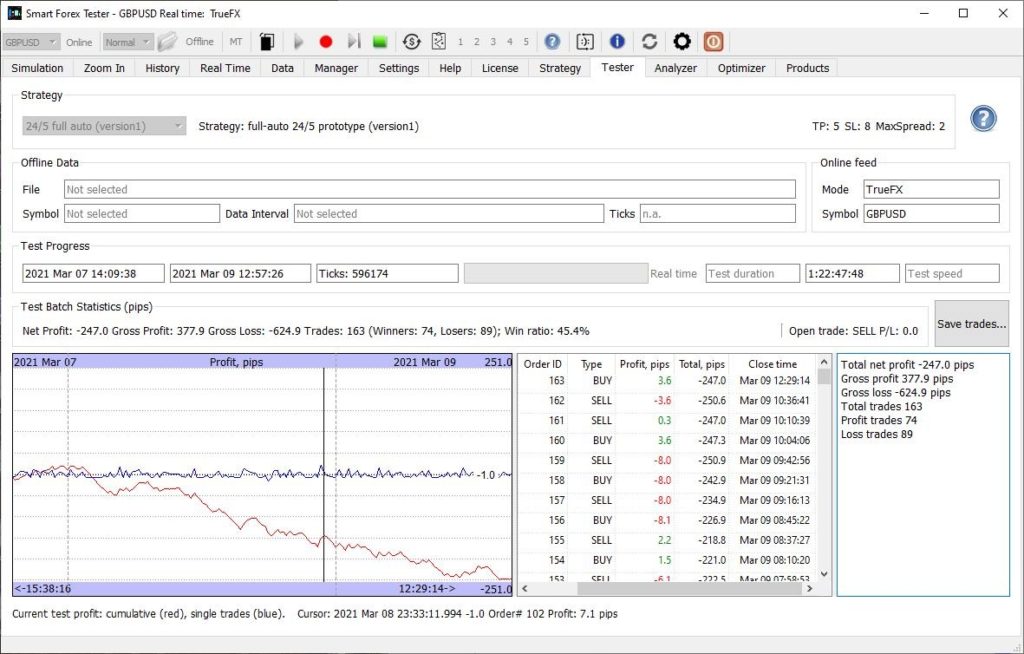
If you want the details, here is the full trade log.
We had to restart the test to update the software to the latest build.
There is little to add about the rest of the week. Volatility was slightly higher, but price action stays the same, so the trading result didn’t improve.
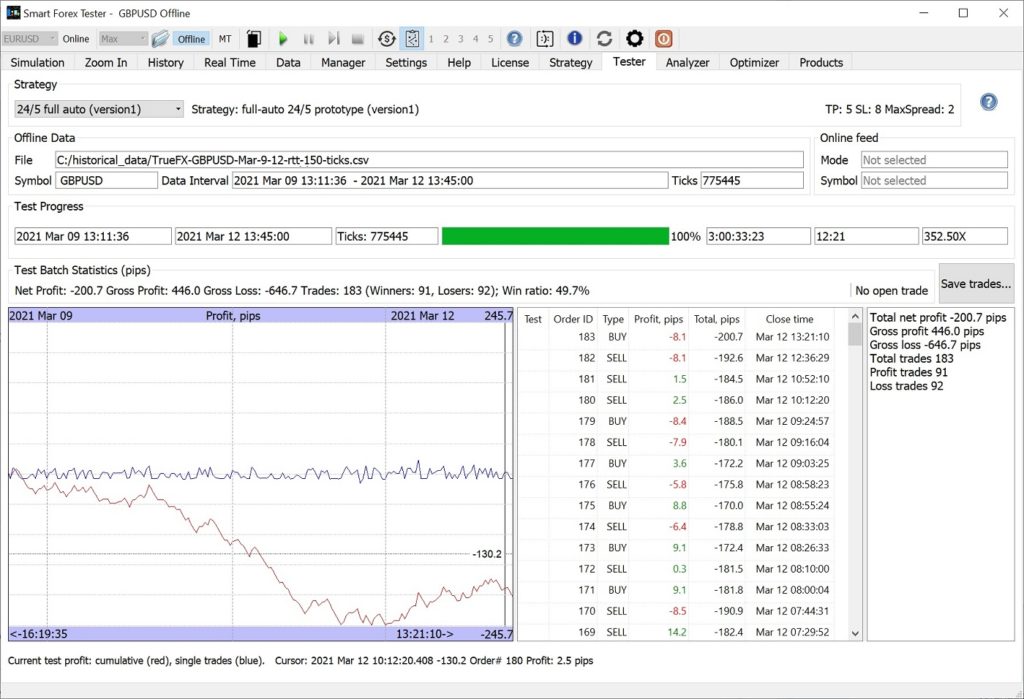
If you want more details: here is the full trade log.
The week March 14-19
Low 194 pips volatility – despite the decent tick rate we had similar patterns.
If you want more details: Trade log.
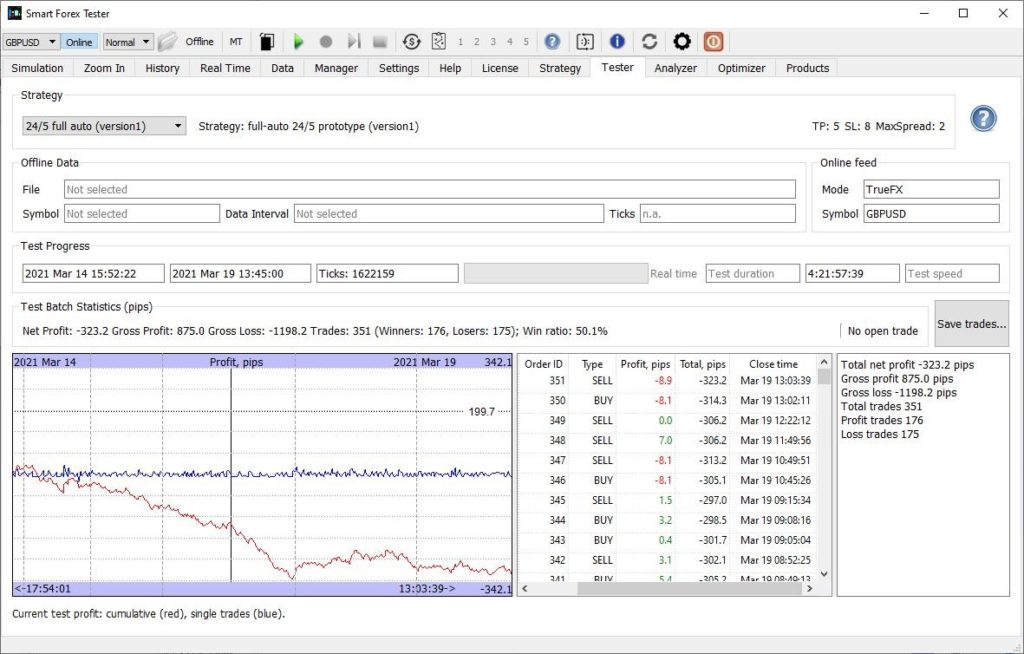
Out of curiosity we ran a series of back tests with different strategy parameters. We could cut total losses 3 times.
However, no parameters could cut losses during March 16-17. The price action during these 2 days was “mission impossible” for the used strategy. We will be add these 2 days to our negative test batch.
Interestingly, the strategy failed to turn profit with overall 50% win ratio. With price action we observed in previous 5 month in most cases it was able to take enough on the trend moves to cover the losses on the rangebound market.
But not now, because the price moves were not big ones to gain enough.
Furthermore the potential win ratio was one of the highest that we ever observed: 87%
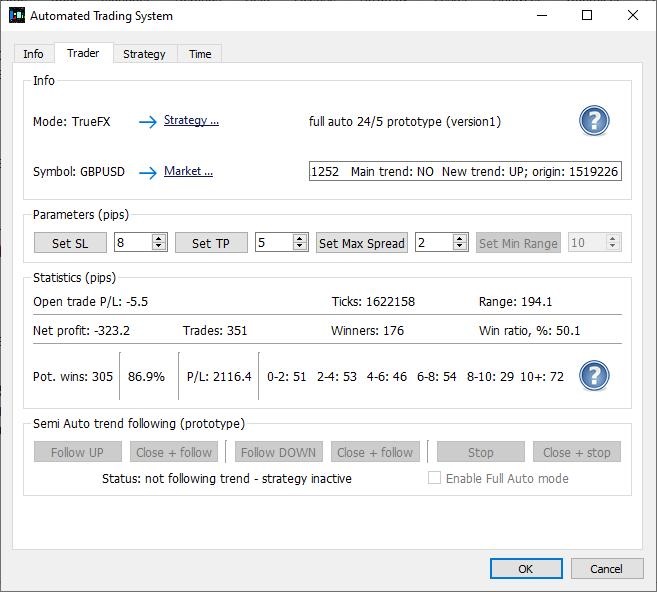
These percentages combined witness again the profit taking algorithm is leaving a lot of money on the tale. There is a huge potential once we make more “greedy”: trying to take what is available + attempt to re-enter on pullbacks.
Week March 21-26
Basically, no changes. Despite good enough tick rate, low 209 pips volatility and choppy market action lead to similar results.
However, due to low win ratio of only 44% the bottom line is twice worse compared to the previous week (when the win ratio was 50%) and set a new anti-record of 612 pips.
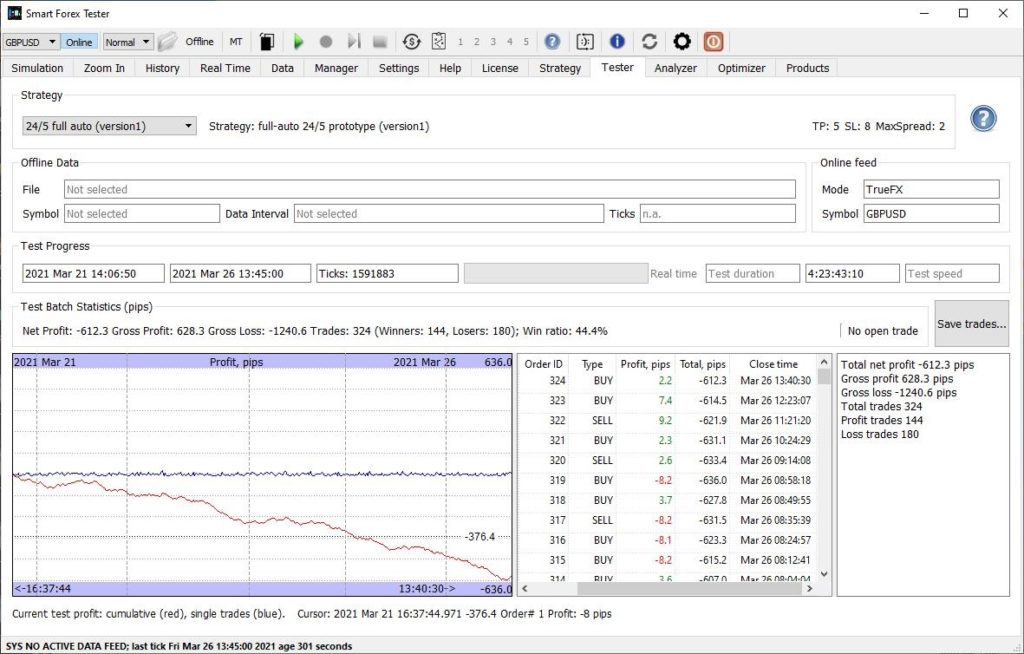
But the potential wins statistics remains basically unchanged.
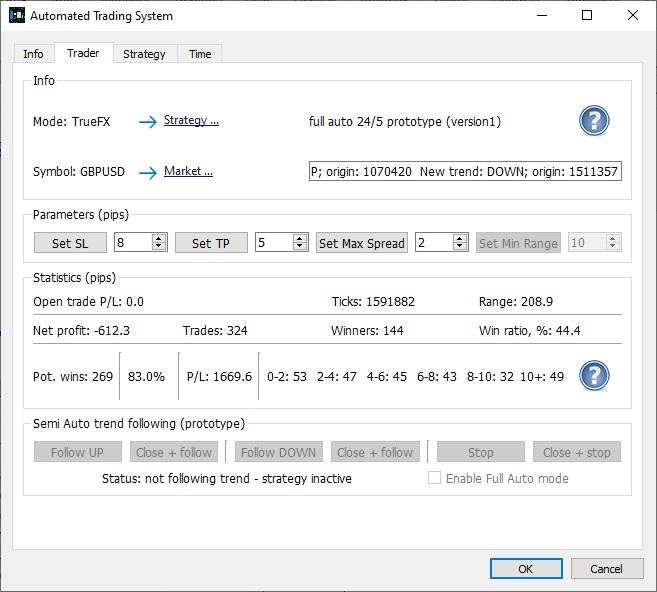
If you want more details: here is the full trade log.
Week March 28-31
No significant market action before Easter. As a result, low win ratio and losses.
