As you may recall, recently we announced our new trading strategy baseline – version2.
In this post we share the results of our testing on GBPUSD during the first 3 weeks of November.
Pound is our preferred instrument, because it is more volatile than many other main pairs and it is traded quite actively.
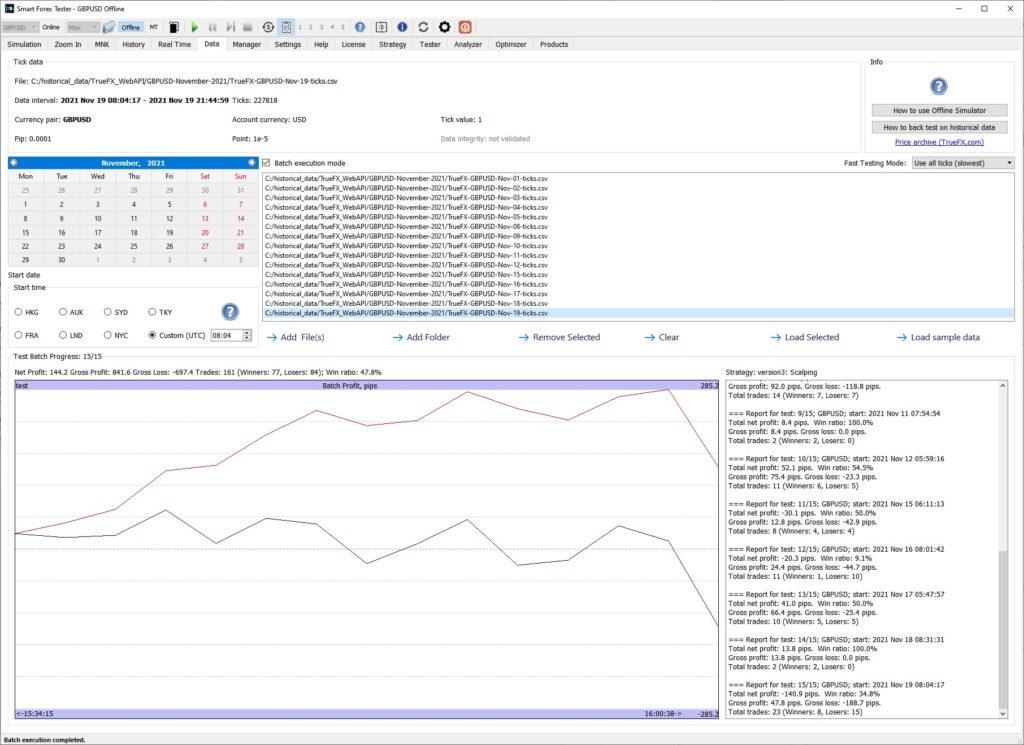
The below screenshot shows the profit development for the first 15 trading days of November 2021. Each trading day, we saved ticks and then we ran them all in our Batch Tester in one go. We only tested during the most volatile time, so we set the Scheduler to restrict trading between 21.40-07.00.

Overall, the result was very positive – 144 pips. And as you can see, the absolute draw down was small on the test batch graph. The same pattern we observed for nearly each test case (i.e. trading day).
You can check the details of every trading day in the trade log.
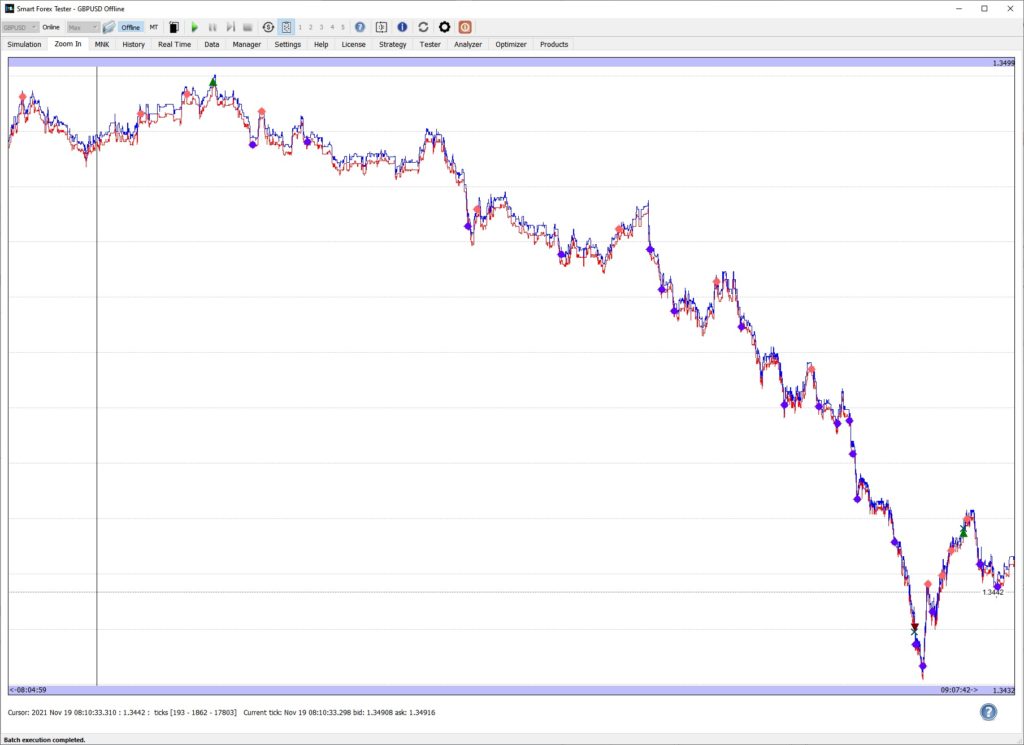
The only day when the trading strategy had a significant draw down was November 19. Let’s take a look what happened then.

We can see that the very first market entry was extremely unlucky. The market turned and started trending in the opposite direction until the stop loss was reached. This is a known issue with the version2 baseline – we called it a “blind spot“, and it is a sequence of 2 events.
First, wrong entry timing. Since all our strategies adjust to the market action, we should have sufficient market data prior to the first entry. This is achieved with a help of the Scheduler – we start couple of hours before the trading is allowed. Case in point, the test was started too late without enough time to collect the data.
Next, the trend is powerful enough not to generate a reversal signal. This is pretty easy to fix, but we haven’t yet found a way to instigate a reversal only in this situation. All the fixes we tried so far had side effects. We continue working on the fix, of course.
Keep these blind spots in mind when you try the new baseline strategy yourself. Fortunately, these situations are not frequent. E.g. in our 3 weeks test, we only had one occurrence.
In addition, since version2 places much fewer trades than its predecessor, it is easy to make necessary corrections manually.
Furthermore, the potential win ratio of version2 is higher than that of version1, and quite often exceeds 90%. This, and fewer trades, gives you ample opportunities to take profits manually, if you want to.
An important point in this regard. Even when an automated trading strategy is running, you can always close the trade it opened – like the BUY position in the example above. But keep in mind that after your manual action the strategy can open a new one immediately after – if the entry conditions are met.
To give you better control over situations like this, we recently added 3 new buttons for manual Automated Trading Strategy control. You can forbid the strategy from opening new trades and also from closing an existing one.
And now these buttons come very handy to deal with occasional blind spots of current version2.
Case in point, when you notice a blind spot like the one on the screenshot, you need to first forbid opening new BUY trades. Then you manually close the current trade and open a SELL trade. Note that you have plenty of time to make a decision.
If you want to repeat our test yourself, here are all the tick data files. We used standard PPA parameters (100/100/254/5/15) and set TP=SL=60 pips. Maximum spread was set to usual 2 pips.
Note that the TP logic of version1 is retained in version2. But we wanted the strategy to use essentially its own logic, so we set the TP to a very big number. If you want, you can experiment with other levels.